Tuesday, March 19, 2024

Help Links

Dashboard Registration - Get New or Add Login's for users      Remote Toolbox Connections - How to setup connections     
Add Device Connections- Methods for adding your stuff (below)   Operations- General operations of Dashboard    

Support Dashboard: What you will see and do first....

            PC System Requirements: Preferred - Win7/8 or Server 2008, 8Gb RAM, Internet Connection (Note: Dashboard is Not running as Win Service).

            Crestron Processor Firmware: 1.08.04 and 4.003.007 or newer contain the firmware client (generally anything after June 2012).

  1. Click on the provide web installation link. The download process will begin. Accept download requests.
  2. When download is completed a start menu folder will be added and a desktop link to restart.
  3. NOTE: Each time the application is restarted it will check the web for authentication and new versions of support files.
  4. Once download is complete the Dashboard will start in the default mode. The Connections List will be the only window open on initial startup of the Dashboard.
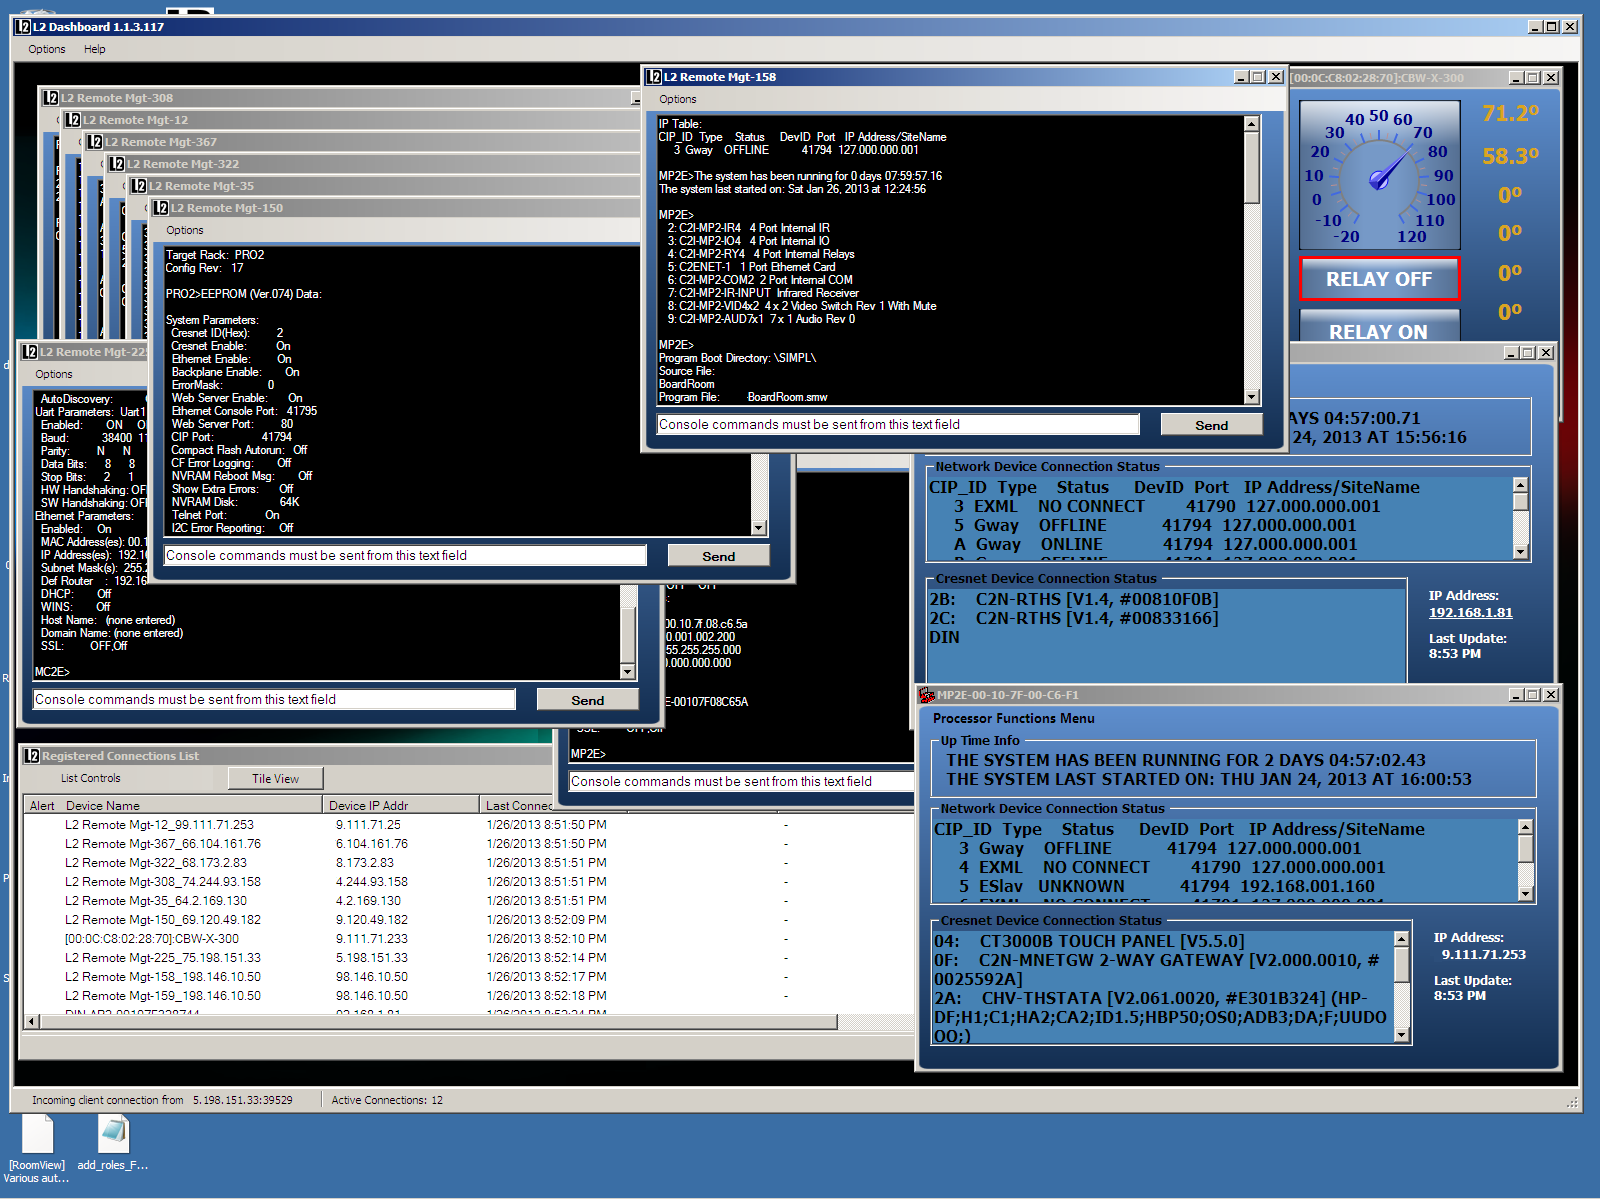
  5. After you have started adding connections to your Dashboard it may look something like this;


Adding Connections to the Dashboard


   There are several methods of adding connections to the Dashboard


Note: Typically connections are inbound, but for Crestron System Outbound Connections are also available, but not often used.

  1. Crestron processors are configured for connectivity (no SMW code required) in 2 ways;
    1. INTERNET LOCATION: via L2 provided configuration applets. These applets will tell the processor to connect to the dashboard when ever network access is available. 
    2. LOCAL NETWORK: From the Dashboard Options menu select Scan for Crestron Devices.
    3. CRESTRON DISCOVERED DEVICES: Right click on processors discovered and select Set Console Connection to this Dashboard. No further actions.
  2. REGISTERED CONNECTIONS LIST: Right click on listed devices for options including Setting Alerts (email notification of disconnect).


  1. ControlbyWeb and other sensor devices provide in their Network Settings a pointer to the Dashboard IP address.
  2. When the device connects the Dashboard will recognize it and set up the proper control window for monitoring.


General Operations of Dashboard


The purpose of the Support Dashboard is to;

  1. Watch connections from critical equipment
  2. Track equipment connection status and log state changes (.csv file in History folder)
  3. Visually alert operators of status;
    1. Dark gray data - connected in the past but not currently connected to Dashboard since last restart.
    2. Black data - connected to Dashboard (Last Connection Time)
    3. Red data - connection lost to dashboard
    4. Green Check - this connection setup for email alert on connection loss


Email Notification of Alerts

You have the ability to set Alerts for lost connections (generally indicating a problem) for any device that has connected to the Dashboard. Right click on the device of interest and select "Set Alert for Device Disconnect" menu item. A green check will appear at the left of the device and will remain active indefinitely. From the Dashboard "Options" menu select "Settings" and you will see the Alert email address entry location. For multiple entries separate by a comma. Click Save when you are done. You will receive email each time the device disconnects from the Dashboard. 

Logs

There any multiple sets of (.csv) logs recorded by the Dashboard;

  1. Registered Connections - this live log is stored in the History folder and reflects what you see in the Registered Connections list.
  2. Connection History - Each device has a log in the History folder that represents all connectivity while the Dashboard is active. The name of the file is the Device Name.


Scanned Crestron Devices

Menu Item Description

  1.  Run Energy Sensor Setup Wizard - This is used when Dashboard used as Energy Monitor. This function changes the IPTable of the device, so don't use if not Energy Sensor.
  2. Set console connection to this Dashboard - This configures the firmware client to reach out to the Dashboard. Very useful if target devices are inside firewall.
  3. Set Console connection to my Company Dashboard - use then in the field to point back to office Dashboard.
  4. Set Console connection to L2 Cloud Services - the upgrade from our Dashboard is to our Cloud hosted services, and this will change the firmware client to that IP Address.
  5. Stop Dashboard connection - this tells the target firmware to stop the active client connection to the Dashboard or L2 Cloud.
  6. Start Dashboard connection - tells the target firmware to start the client connection to what ever it has been pointed (L2 cloud or Dashboard).
  7. Update Firmware - this only applies to our Energy Dashboard for DIN-AP2 processors. It will soon select firmware for all processors.


 User Settings

  1. Email Text box - if you want to set alerts, this is where you store the target email address(es). Separate multiple email addresses with commas. Some hardware allows individual addresses.
  2. Host alternate IP address - If running VMware or on a server with multiple Network Connections you should enter the IP Address you will point all devices. Default is empty.
  3. My Company's Dashboard IP Address - If you are using the Dashboard as a tool in the field you may want to point Device connections at some other address.
  4. Show Unknown Connection Console - if an unknown device connects you can show a simple text console to interact with that device.
  5. Use Tool Tips - If you are new to the Dashboard then you will want to leave this turned on to get operation tips as you progress.
  6. Connection Timeout - This defaults to 20 seconds. If you have devices that are slow identifying themselves after connection then you want this to be slow so you don't end up with "Unknown" device connections. If you have fast responding devices then you can set this lower to speed up connection cycle.
  7. If you are using Energy Sensors you can set the size of the window displayed.
    1. Small - simple gage with local temperature sensors.
    2. Medium - has two modes of chart size. Double click chart to change.
  8. Reset Welcome Window - Re-enables the initial start up wizard.


Dashboard Cresnet Tools


Cresnet Tools   
   

Trouble shooting and Diagnostics

If you have Questions, Problems or challenges please link over to the Support Forum here.